
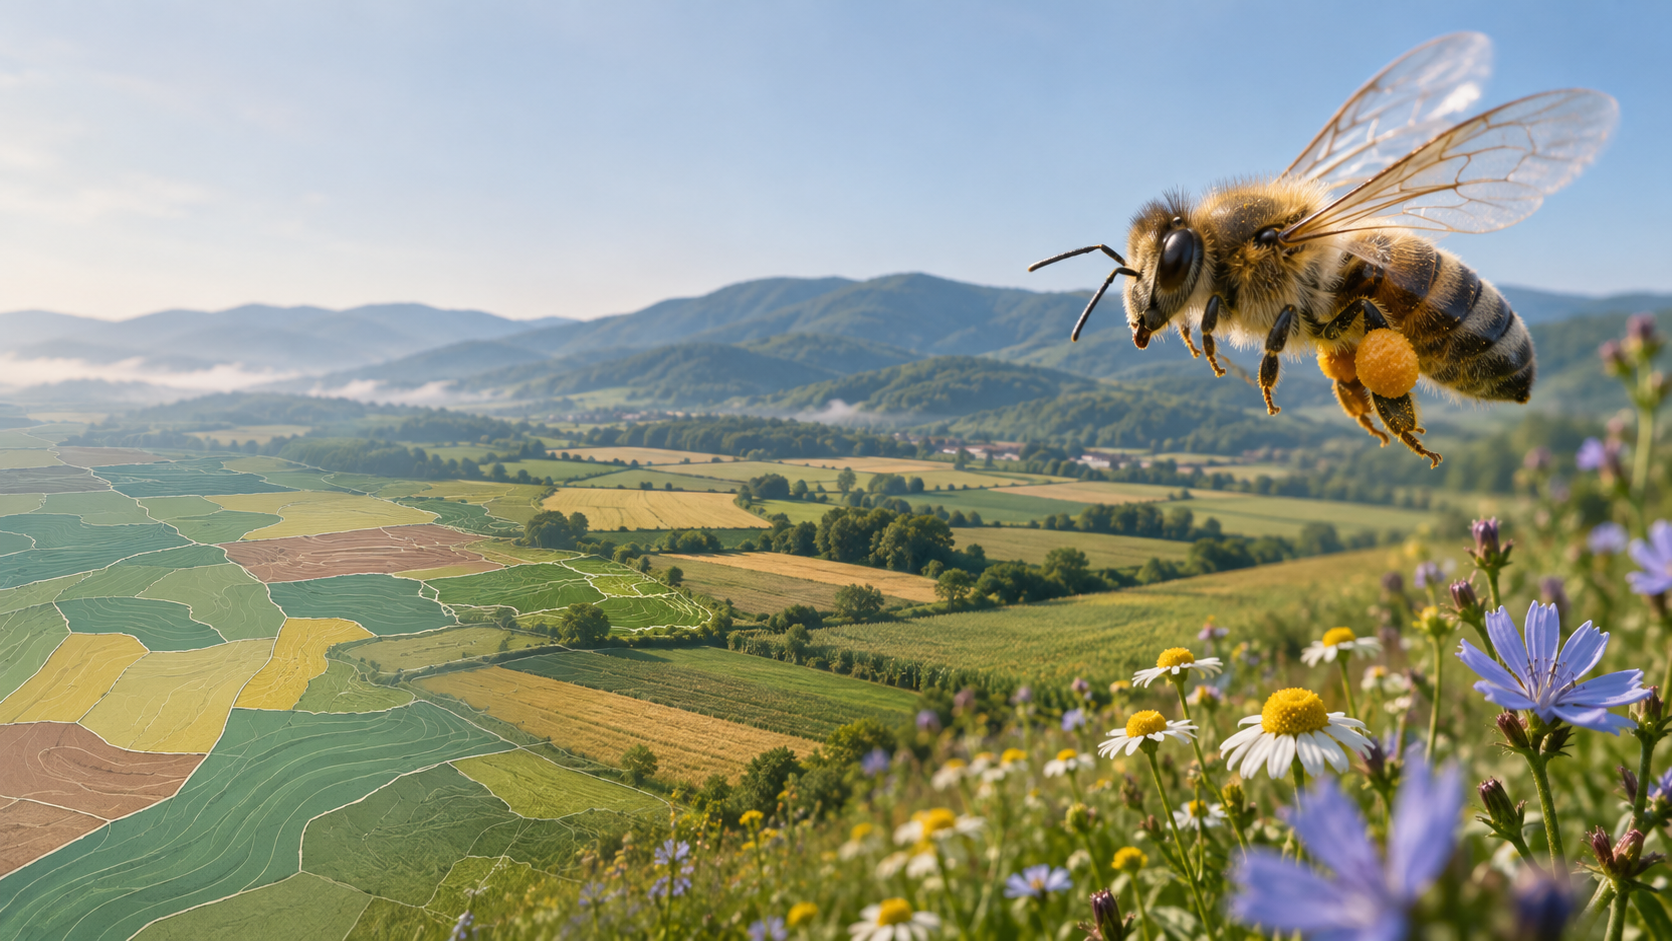
A season of pollen DNA and lab chemistry across seven Bulgarian landscapes shows how far a land-use map can miss, and what a better reading lets you do.
On a land-use map, Radevo looks unremarkable: a mixed agricultural landscape in Central Dobrudzha, the kind of place a desktop assessment files under “moderate.”
Then you read what the bees carried home. Radevo produced the most pesticide compounds of any site in our seven-site network, three above the analytical limit of quantification. Crops accounted for 70% of its pollen DNA reads, the highest share we recorded.
The map said mixed. The chemistry said intensive. The bees agreed with the chemistry.
That gap is the reason EcoPulse exists. Pollenity, the environmental intelligence brand of Bee Smart Technologies, treats honeybee colonies as a living sensor network. In 2025 we put that idea through a public test, in a project run by the non-profit Foundation “Real Honey” and co-financed by the America for Bulgaria Foundation, with UniCredit Bulbank co-funding the Sofia site. Pollenity analysed the data.
“A land-use map tells you what a place is supposed to be. A hive tells you what is in bloom there, and what came along with it.” — Sergey Petrov, founder and CEO, Pollenity
A sensor network that flies
Most environmental monitoring has two blind spots. A fixed sensor knows about one point, and a field survey knows about one day. A landscape can change a lot between those readings.
A honeybee colony covers both gaps. Between 50,000 and 80,000 bees send foragers up to three kilometres from the hive, a circle of up to about 28 square kilometres. They work it day after day, from spring into autumn, and carry samples of it home.
Trained beekeepers collected that pollen with standardised traps at the hive entrance, in three windows from April to September. The 50 to 60 samples then went down two separate pipelines:
- The biology. DNA metabarcoding (ITS2 marker, Illumina MiSeq) identified which plants the bees had visited.
- The chemistry. ICP-MS measured ten metals, and GC-MS/MS and LC-MS/MS screened for more than 500 pesticide compounds.
We call this the dual lens: one reading for what lives in a landscape, one for what contaminates it. Each site then received a grade from A to D.
The weather made the test harder. Summer rainfall from June to September came in 47% to 77% below the 2001–2023 average across all seven sites. Drought changes what flowers and therefore what bees collect, so 2025 is a baseline with an asterisk. It also gives future seasons a hard comparison point.
Where the map broke
We started with a tidy hypothesis: forests good, cities bad, farms somewhere in between. The data backed the broad gradient, then broke it in the places that matter most.
Three farms, one label, three different stories. Trastenik, Zhitnitsa and Petarch are all classed as intensive arable, and all three graded C. From above they look alike. From inside the hive they do not.
Trastenik had the lowest plant richness in the network, at 12 species. Some 73% of the season’s pollen arrived in the late window, August to September, which points to a landscape with very little forage from April to July. The lab also found metrafenone, a fungicide.
Zhitnitsa is the paradox. It sits in a landscape that is 70% cropland, yet it recorded the highest richness of all: 29 plant taxa and a Shannon diversity index of 2.8. Nothing crossed the pesticide threshold. Chamomile alone made up 20% of the reads. The likely explanation is that colonies were working every wild patch within reach, so the diversity lives in the margins.
Petarch, on the edge of Sofia, drew 53% of its reads from semi-natural plants. That is more than double Radevo’s 25%, even though Radevo carries the milder land-use label.
A clean-looking forest is not a guarantee either. Vrabevo, in the Stara Planina foothills, was one of our two best sites. Wild and semi-natural plants made up 76% of its reads, despite covering just 3.3% of the mapped foraging radius. Even so, the bees brought back traces of bifenthrin, a pyrethroid insecticide. Agrochemicals do not stop at a land-cover boundary, and neither do bees.
Put together, this is the central finding: biodiversity and contamination are decoupled. A rich landscape can carry a chemical signal, and a farmed one can test clean. Neither lens predicts the other, which is why we measure both.
Sofia: plenty to eat, and a history in the soil
Sofia received the only D in the programme. The surprise was the route the signal may have taken.
City bees did not go hungry. Plant richness was moderate, and the forage held up through the drought better than at most rural sites. Dandelion accounted for 33% of the reads and chicory for 27.5%. These are tough, deep-rooted urban plants.
They are also known for taking up metals from contaminated soil. Sofia recorded the highest lead and the highest mercury of any site, a pattern consistent with decades of traffic and combustion and with the city’s industrial legacy. Our working reading is that the same plants that fed the bees through the drought also carried part of that history into the hive. One season cannot prove this mechanism, but it does tell us exactly where to look next.
The finding also needs a clear boundary. No food-safety reference standard was exceeded at any site, and these are measurements of pollen, not honey. Sofia’s D is an environmental diagnosis, not a food-safety verdict.
Seven sites at a glance
Each grade combines plant richness, diversity, the mix of wild plants and crops, seasonal continuity and contamination load. It is a summary, so the two right-hand columns matter more than the letter.
| Site | Landscape | Grade | What the biology showed | What the chemistry showed |
|---|---|---|---|---|
| Vrabevo | Forest–agriculture mosaic | A/B | 76% semi-natural reads from 3.3% of mapped area | Trace bifenthrin |
| Mladen | Forest–agriculture mosaic | A/B | 63% semi-natural reads; 61% tree cover | Low-level cadmium signal |
| Radevo | Mixed agriculture | B | 13 species; 70% crop reads | Three pesticide compounds, the most in the network |
| Trastenik | Intensive arable | C | 12 species; 73% of pollen in the late window | Metrafenone |
| Zhitnitsa | Intensive arable | C | 29 taxa; Shannon index 2.8 | No pesticide above threshold |
| Petarch | Intensive arable, peri-urban | C | 53% semi-natural reads | No pesticide above threshold |
| Sofia (Vrazhdebna) | Urban | D | 60.5% of reads from dandelion and chicory | Highest lead and mercury in the network |
From pollen to a decision
A grade on its own changes nothing. The value is in what a beekeeper, land manager or sustainability lead does differently once they have the reading. Here is how we would act on each signal.
| The signal | What it suggests | The decision it informs |
|---|---|---|
| Most pollen arrives late (Trastenik) | A spring and early-summer forage gap | Add early-flowering margins or strips; for beekeepers, plan feeding and hive placement around the gap |
| Diversity concentrated in wild patches (Zhitnitsa) | Small margins may be doing outsized work | Protect those patches; time mowing around flowering rather than the calendar |
| Chemistry heavier than the map implies (Radevo) | Land-use class is hiding real pressure | Prioritise the site for follow-up, even with a B on paper, and trace the source with local farmers |
| Pesticide traces in a good landscape (Vrabevo) | Exposure reaches beyond the land you manage | Look past the fence line before drawing conclusions about your own operations |
| Metals in an urban signal (Sofia) | A possible link between soil, plants and bees | Commission targeted soil testing before acting; factor it into urban hive siting and green-space planning |
This is the same logic we bring to solar parks, industrial sites and other land that operators must answer for. The first question is always what you need to know. The hive count, sampling calendar and analyses follow from that.
The bees also add a signal of their own. At every site, the semi-natural share of pollen reads exceeded the semi-natural share of mapped land. When that gap is wide, as at Vrabevo and Mladen, it suggests a varied landscape that rewards foraging. When it narrows, as at Radevo and Trastenik, it can be an early hint that farming has crowded out what colonies need. And it comes at no extra cost, from data already collected.
What the data can’t tell you
A sensor is only useful if you know where it fails, so here is where this one does:
- Reads are not abundance. DNA sequencing shows which plants are in a sample. Read shares are a guide to composition, not a precise measure of how much of each plant is there.
- Bees are selective. Results describe the plants bees used, not every plant in the landscape. Wind-pollinated species are under-represented.
- A residue shows exposure, not a source. Finding a compound tells you the bees met it. Locating where it came from takes more work.
- One season is one season. 2025 was also an unusually dry one, so every finding here is a baseline rather than a trend.
These limits are why EcoPulse complements botanical surveys, remote sensing and physical sampling instead of replacing them.
A photograph, not yet a film
The 2025 season shows that the method can separate landscapes that a map lumps together. It can’t yet say whether Sofia is improving, whether Trastenik’s diversity can recover, or whether Radevo’s pesticide load is rising. Those answers take the same sites, sampled the same way, over several years.
Bulgaria’s bees will keep doing the fieldwork either way. The useful question is who reads it.
Answering for land you don’t fully control? Discover EcoPulse or discuss a monitoring project with our team.
EcoPulse was executed from February 2025 to February 2026 by Foundation “Real Honey” (Фондация „Истински мед”). It was co-financed by the America for Bulgaria Foundation, Foundation “Real Honey” and, for the Sofia site, UniCredit Bulbank. Data analysis by Pollenity. The project is independent of any government, political party or movement. Disclosure: Pollenity’s founder also founded Foundation “Real Honey”. Chemical detections are reported relative to analytical limits of quantification, and all single-season results should be read with caution.
Content is provided for informational purposes. Findings from individual monitoring programmes should be interpreted in the context of their methods, sampling scope and limitations.