
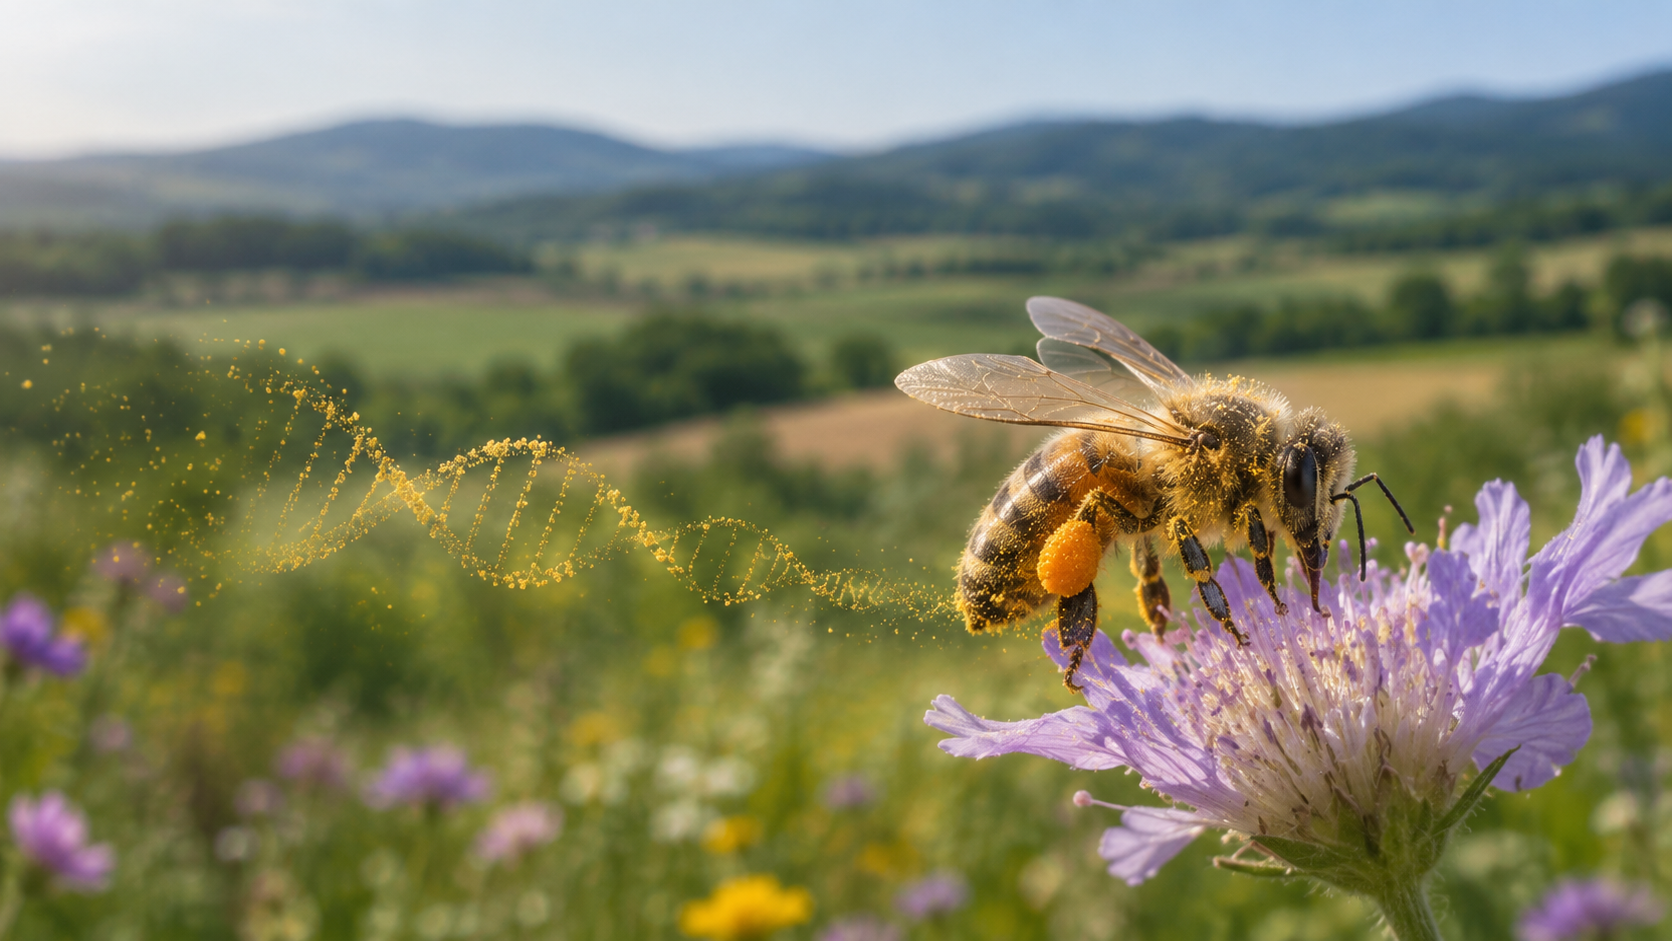
Metabarcoding reads the DNA in a mixed sample and tells you which species are in it. Apply it to the pollen a honeybee colony brings home, and an ordinary hive starts reporting on the land around it.
Environmental monitoring has a sampling problem. A fixed sensor knows about one point. A botanist knows about the day of the visit. A satellite sees a green field but can’t say what is flowering in it, or what has settled on those flowers.
Bees don’t have that problem. They already visit the landscape, millions of times a day, and they carry pieces of it back to one address. What was missing for most of beekeeping’s history was a cheap, reliable way to read what they carried. Metabarcoding is that way.
What metabarcoding is
Metabarcoding identifies many species at once from a single mixed sample, using standard stretches of DNA and high-throughput sequencing (Lowe et al., 2022). Think of a supermarket scanner reading a whole trolley in one pass. Each species has its own barcode, and the sequencer reads them all, then checks them against a catalogue.
For pollen, the work runs in five steps:
- Collect. A trap at the hive entrance gathers fresh pollen from returning foragers. Honey and stored pollen work too, and give a longer view.
- Extract. The tough pollen wall is broken open, usually by shaking it with tiny beads, and the DNA is purified.
- Amplify. PCR copies the barcode regions. The 2022 review recommends two for pollen: rbcL and ITS2.
- Sequence. Tags on each sample let hundreds or thousands of samples share a single sequencing run, which is what makes the method scale.
- Match. Software compares each read with a reference library of known plants, and botanical expertise catches the unlikely results.
The output is a list of plants, each with its share of the DNA reads. The older method, identifying grains under a microscope, is slow and takes rare expertise. Several comparisons found that metabarcoding detects more species and separates them more finely.
The numbers: a network that already exists
No one has to build this network. There are about 101.7 million managed colonies worldwide, and beekeepers already look after them.
| Measure | Figure | Source |
|---|---|---|
| Managed colonies worldwide, 2024 | 101.7 million | FAO, via Destatis |
| Managed colonies in Europe, 2024 | 25.4 million | FAO, via Destatis |
| Beehives on Bulgarian farms, 2023 | 1.0 million, fourth in the EU | Eurostat |
| Bees in one colony | 10,000 to 80,000 | Cunningham et al., 2022 |
| Foragers in a mature colony | 20,000 to 50,000 | Cunningham et al., 2022 |
| Trips per forager per day | About 10 (range 7 to 13) | Commonly cited beekeeping figure |
| Flowers visited per trip | 100 to 1,000 | Commonly cited beekeeping figure |
Those last two figures vary widely, and effort is uneven. In one tracking study, 19% of foragers made half of the colony’s trips.
So take a deliberately low case of our own: 10,000 active foragers, five trips each and 100 flowers per trip. That is still about five million flower visits by one colony in one day. No survey team comes close to that sampling effort.
How bees forage, and why that makes them good samplers
A colony behaves less like a swarm of insects and more like a survey that redirects itself every day. Four habits make it useful.
They cover real ground. In one classic study, a colony foraged a median of 1.7 km from its nest, with 95% of foraging within 6 km. The rare maximum is around 14 km. A 3 km radius alone takes in about 28 square kilometres.
They go further when food is scarce. Across a rural-urban landscape in England, mean foraging distance moved from 493 m in spring to 2,156 m in summer, then fell to 1,275 m in autumn. The area in use grew from 0.8 to 15.2 square kilometres. So the size of the footprint is itself a signal about the landscape.
They share what they find. A forager that finds a good patch performs a waggle dance that encodes its distance and direction. The colony pools these reports, adjusts its foragers at least daily and concentrates on the best patches. Sampling follows what is actually in bloom, not a schedule.
They choose consistently. At the National Botanic Garden of Wales, 437 plant genera were in flower, and the bees used only 11% of them. Ten taxa made up 96% of the DNA reads, and all three hives favoured the same core plants. For an instrument, that repeatability matters. What turned up in the honey also tracked what was flowering on site.
What the bees bring home
A forager brings back far more than food. She touches plants, air, water and soil, and particles stick to her hairy body, partly through electrostatic forces. Some of what she carries ends up in the bees, pollen, honey and wax, where it can be measured.
Metabarcoding reads the biological part of that cargo. Metals and pesticides need separate chemistry, which is why serious monitoring pairs the two.
| Signal | What it can show | Where it is read | Typical method |
|---|---|---|---|
| Plants | What is flowering and what bees use, by season | Fresh pollen, stored pollen, honey | DNA metabarcoding |
| Plant pathogens, invasive species | Fungi, viruses and new plants in the area | Pollen, bees | Metabarcoding, RNA sequencing |
| Heavy metals | Traffic, industry, mining | Bees, pollen, honey, wax | Mass or atomic spectrometry |
| Air pollutants | Combustion products, PCBs, fine particles, microplastics | Bees, honey, pollen | Chromatography, electron microscopy |
| Pesticides | Which agrochemicals reached the foragers | Pollen, wax, bees | Chromatography with mass spectrometry |
The 2022 review by Cunningham and colleagues collects striking examples:
- Early warning. In Australia, a cucumber virus showed up in bee samples three months to three years before it was found in diseased plants, depending on the region.
- Pollution mapping. In Vancouver, honey from downtown carried more human-sourced trace elements than honey from suburban and rural areas. Lead isotopes in honey near the port were consistent with shipping emissions.
- Farm chemistry. A US study found 120 agrochemical ingredients or breakdown products in bee-collected pollen.
The same review treats climate stress and antimicrobial resistance as promising but still in need of confirmation.
EcoPulse uses this two-part approach. In a 2025 project across seven Bulgarian sites, run by Foundation “Real Honey” with data analysis by Pollenity, ITS2 metabarcoding identified the plants. Lab chemistry measured ten metals and screened for more than 500 pesticide compounds. At Radevo, which looks mixed on a land-use map, crops made up 70% of pollen DNA reads, and the site had the most pesticide compounds in the network.
What the method can’t tell you
A bee-based reading is strong evidence about a landscape, but it has clear limits:
- Read shares are not exact amounts. Researchers treat metabarcoding as semi-quantitative. Its percentages are most reliable for the abundant plants, and they are not a precise measure.
- Bees are selective. A plant list shows what bees used, not everything that grows there. It complements a botanical survey and doesn’t replace one.
- The catalogue sets the ceiling. A plant missing from the reference library can’t be correctly named, and rare plants are easy to miss.
- DNA doesn’t reveal why a bee visited. Pollen on a bee can’t show whether she came for pollen, nectar or resin, and airborne pollen can contaminate samples.
- Finding a residue doesn’t locate its source. Detection shows that bees met a compound. Sensitivity also varies by target, hive and sample type.
- Methods aren’t standardised yet. Results are safest to compare when the same sites are sampled the same way, over several years. Our own 2025 season was also unusually dry, so we treat it as a baseline, not a trend.
Why it’s a good idea anyway
Bees give monitoring something hard to buy: broad, repeated sampling from a sensor that largely runs itself. Each colony covers square kilometres, not a single point, and it works from spring into autumn.
The colony is tougher than its parts, too. Individual bees are vulnerable, but a colony can accumulate contaminants or respond to them without collapsing. That makes long-term tracking of one place possible.
The rest of the system is already there as well. Hives and beekeepers are already widespread, pollen traps are simple, and sequencing lets many samples share a run. What the hive adds is a direct reading of what is flowering on the land, and what came along with it.
The bees are doing this fieldwork whether anyone reads it or not. Responsible for land you need to understand? Discover EcoPulse or discuss a monitoring project with our team.
Sources
- Lowe et al. (2022), Using DNA Metabarcoding to Identify Floral Visitation by Pollinators, Diversity
- de Vere et al. (2017), Using DNA metabarcoding to investigate honey bee foraging, Scientific Reports
- Cunningham et al. (2022), Honey bees as biomonitors of environmental contaminants, pathogens, and climate change, Ecological Indicators
- Meacci et al. (2025), Harnessing Electrostatic Forces, Insects
- Visscher and Seeley (1982), Foraging Strategy of Honeybee Colonies in a Temperate Deciduous Forest, Ecology
- Couvillon et al. (2014), Waggle Dance Distances as Integrative Indicators of Seasonal Foraging Challenges, PLoS ONE
- Frontiers in Ecology and Evolution (2015), comparative analysis of bee foraging distances
- Klein et al. (2019), Honey bees increase their foraging performance and frequency of pollen trips through experience, Scientific Reports
- Destatis, Global honey bee population on the rise (FAO estimates)
- Eurostat (2026), EU beehives up to record 9.4 million
- Wikipedia, Honey flow
Content is provided for informational purposes. Findings from individual monitoring programmes should be interpreted in the context of their methods, sampling scope and limitations.